Email Communications Summary - Interactions Tab
The Interactions tab on the Report Results panel on the Email Communications Summary screen is used to view the number of vehicle sales from Email messages based on the type of interaction that generated the sales, such as service appointments or sales campaigns.
Note - Gross profit information only displays on this tab if the View Gross Profit check box is selected on the Report Criteria panel.

|
To access the Interactions tab, select the Interactions tab on the Report Results panel on the Email Communications Summary screen. |
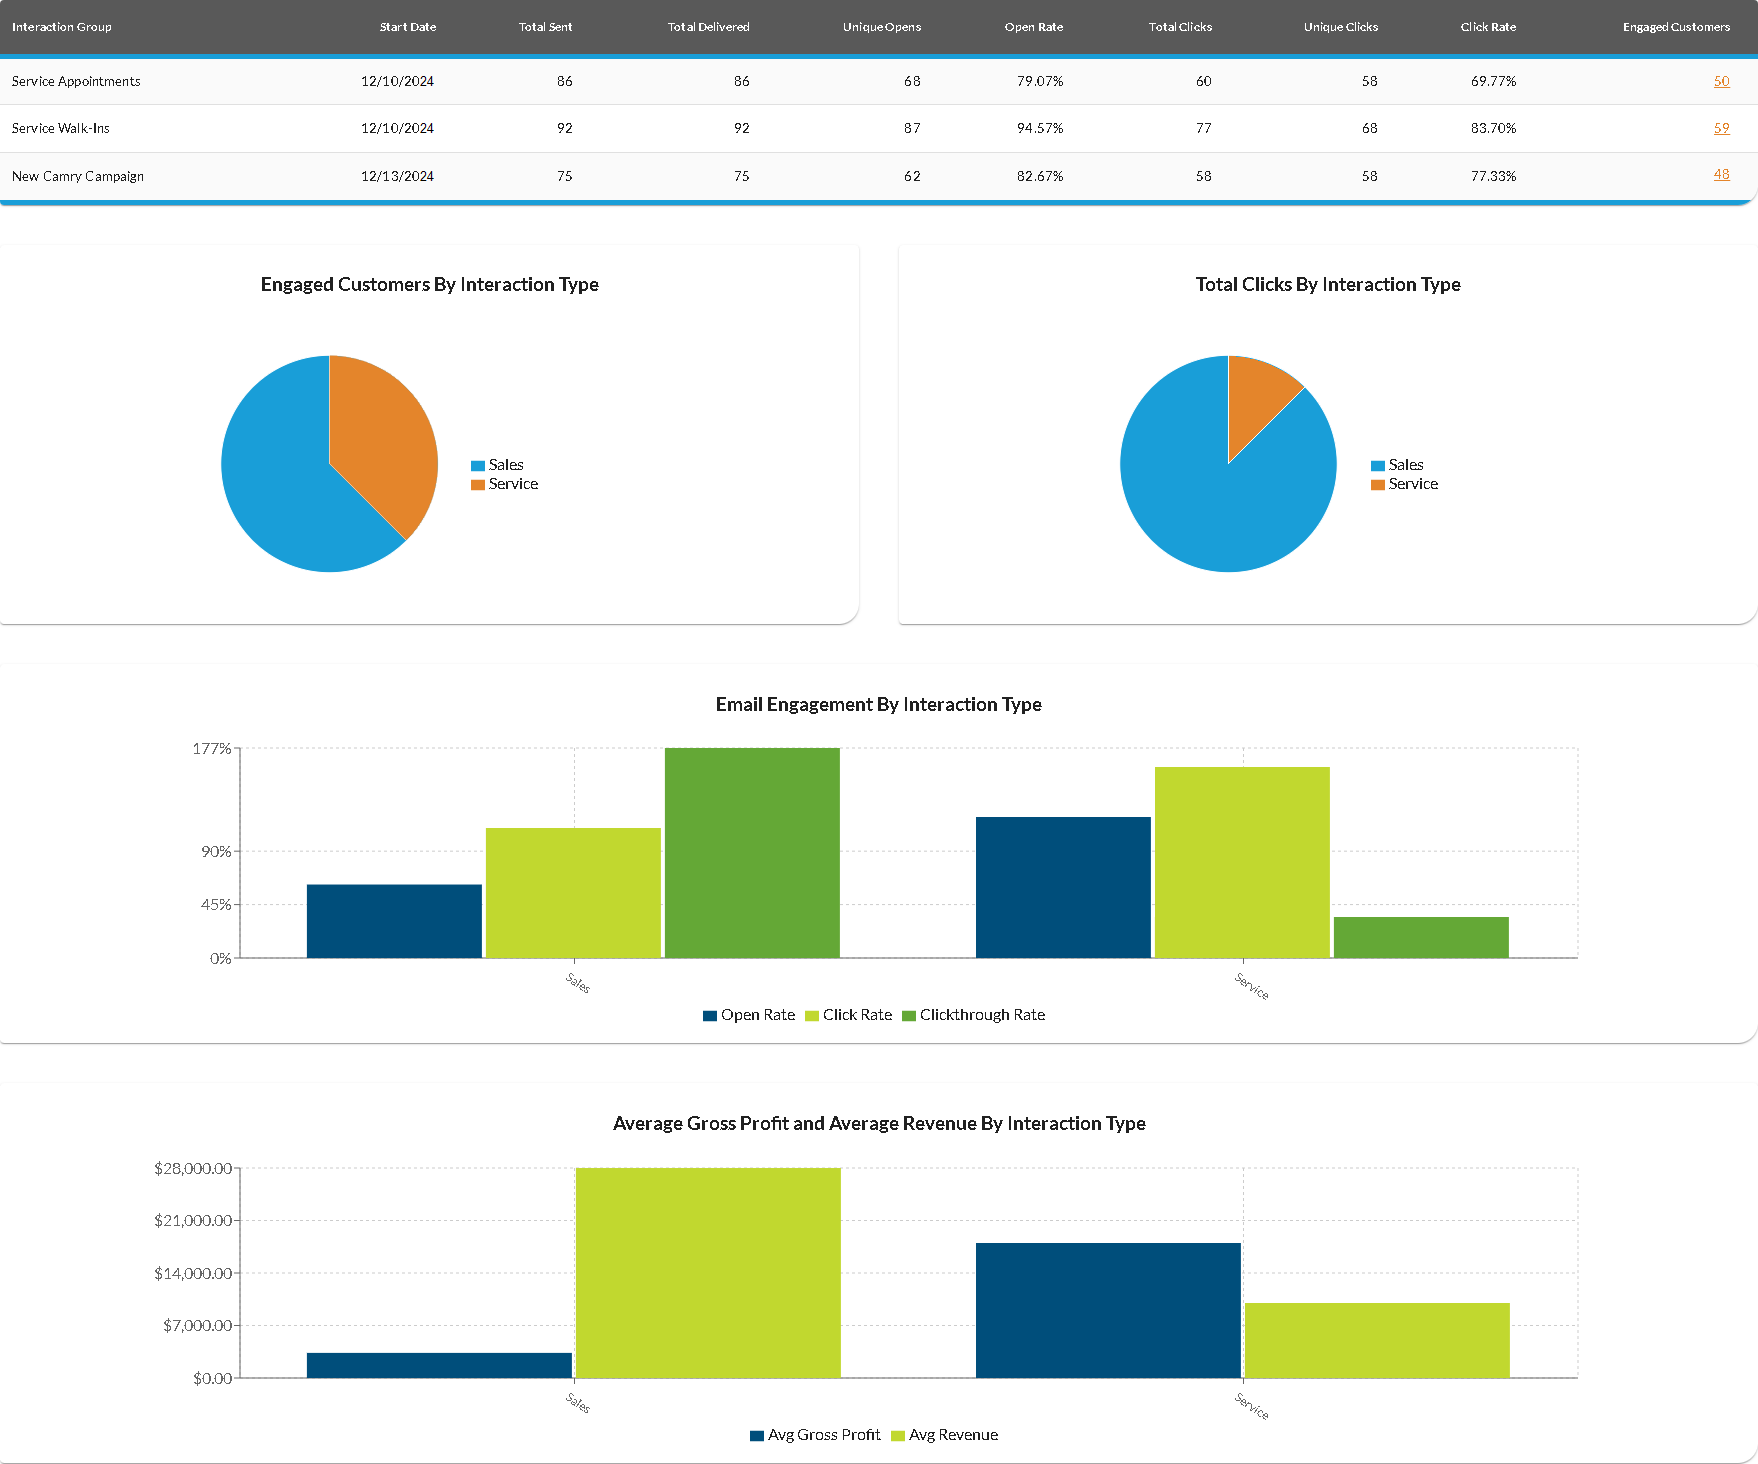
The Engaged Customers By Interaction Type graph displays the percentage of customers who clicked links in Email messages for each type of interaction. Similarly, the Total Clicks By Interaction Type graph displays the percentage of clicked links in Email messages for each type of interaction. Hover the mouse cursor over a section of the graph to display a tooltip with the corresponding percentage.
The Email Engagement By Interaction Type graph displays the percentage of customers who clicked links in Email messages for each type of interaction. Hover the mouse cursor over a section of the graph to display a tooltip with the corresponding percentage.
The following columns are available on the Interactions tab.
Interaction Group: The type of customer interaction associated with the
Start Date: The date on which the sales campaign began displays.
Total Sent: The number of Email messages sent to customers during the entered date range displays.
Total Delivered: The number of Email messages received by customers during the entered date range displays.
Unique Opens: The number of times Email messages were opened by customers for the corresponding interaction type displays.
Open Rate: The percentage of Email messages sent during the entered date range which were opened by customers displays.
Total Clicks: The number of times customers clicked links in Email messages
Unique Clicks: The number of
Click Rate: The percentage of customers who clicked
Engaged Customers: (Link) The number of customers who clicked links in an Email message
Click here for a list of products that may be mentioned in this help file.